Showing posts with label geology. Show all posts

Tuesday, 24 February 2015

Time Chart Area for Tablet

https://zoomcharts.com/en/gallery/all:time-chart-area-gold-prices

ZoomCharts’ Area feature simplifies the process of presenting information in time charts by allowing users to view your data with greater speed and comprehend it with greater efficiency. Rather than using simple lines to connect data points, entire areas are filled with solid blocks of color.

ZoomCharts’ Area time charts are being used to enhance data visualization in a variety of educational fields, including science and mathematics, such as anatomy, biochemistry, ecology, microbiology, nutrition, neuroscience, physiology, zoology, chemical engineering, geochemistry, molecular biology, geology, paleontology, physics, astronomy, algebra, computer science, geometry, logic, and statistics, and the arts such as, music, dance, theatre, film, animation, architecture, applied arts, photography, graphic design, interior design, and mixed media.

- Instead of colored lines, display data using entire colored areas
- Colored areas help to clearly distinguish information
- Vibrant areas heighten the user’s visual experience


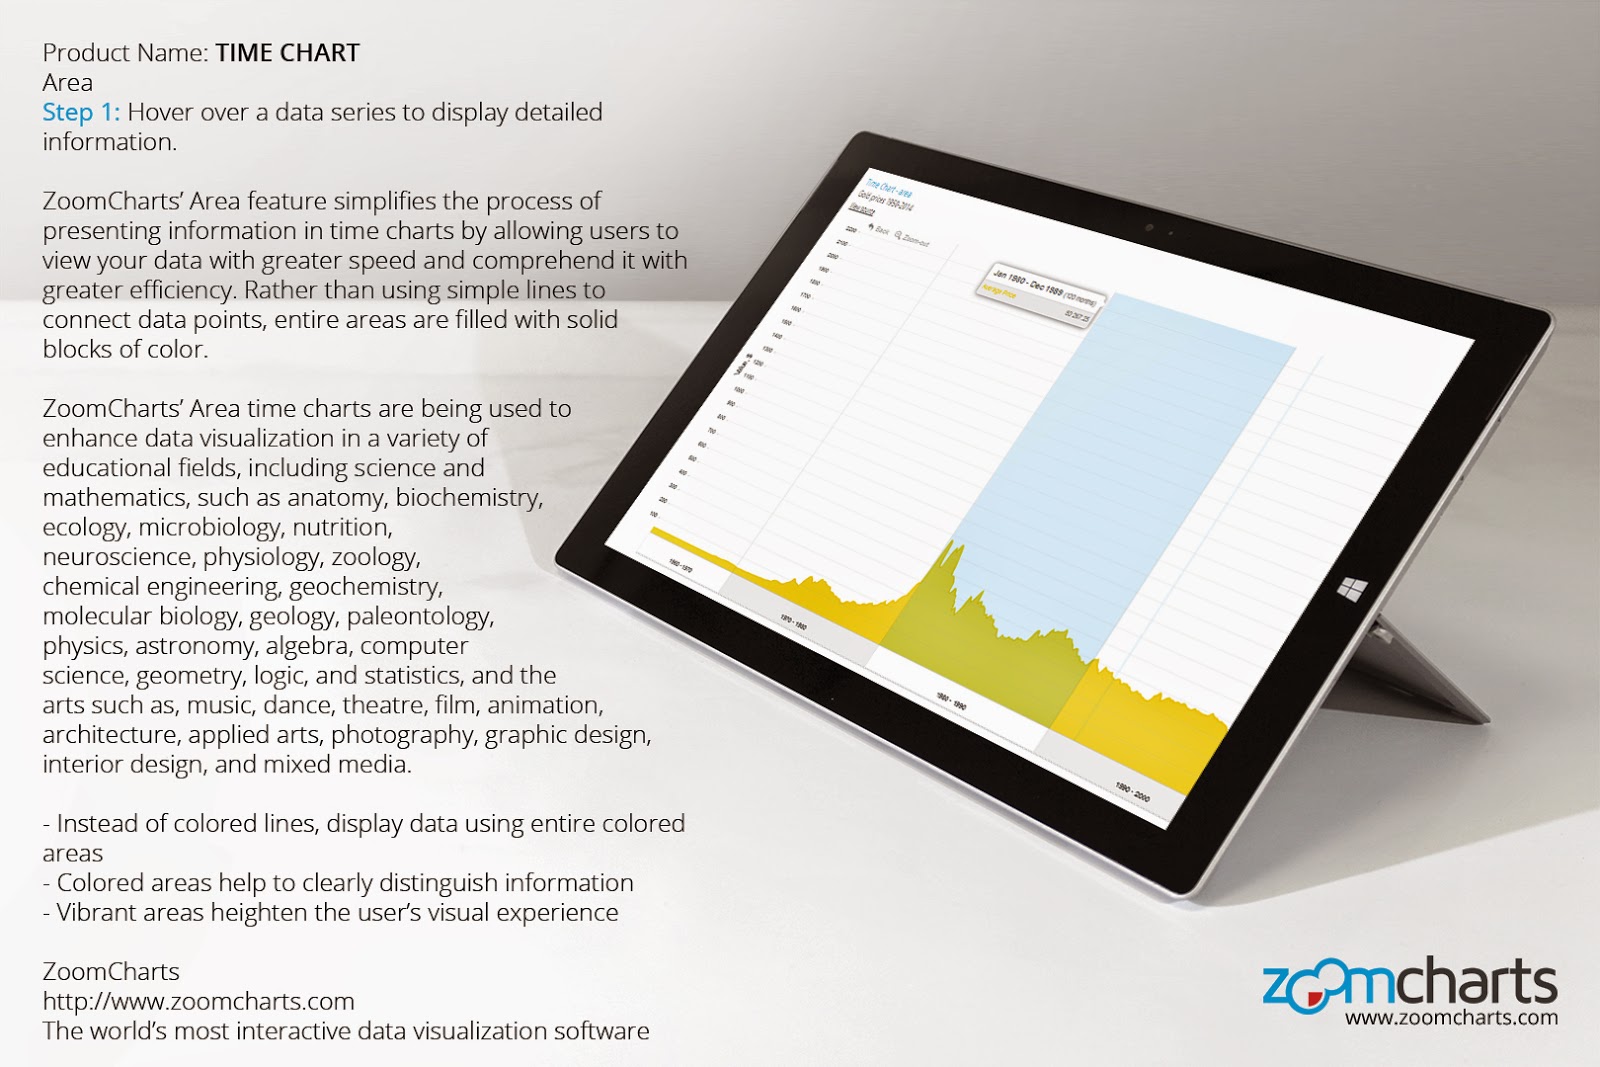
Step 1 Hover over a data series to display detailed information.

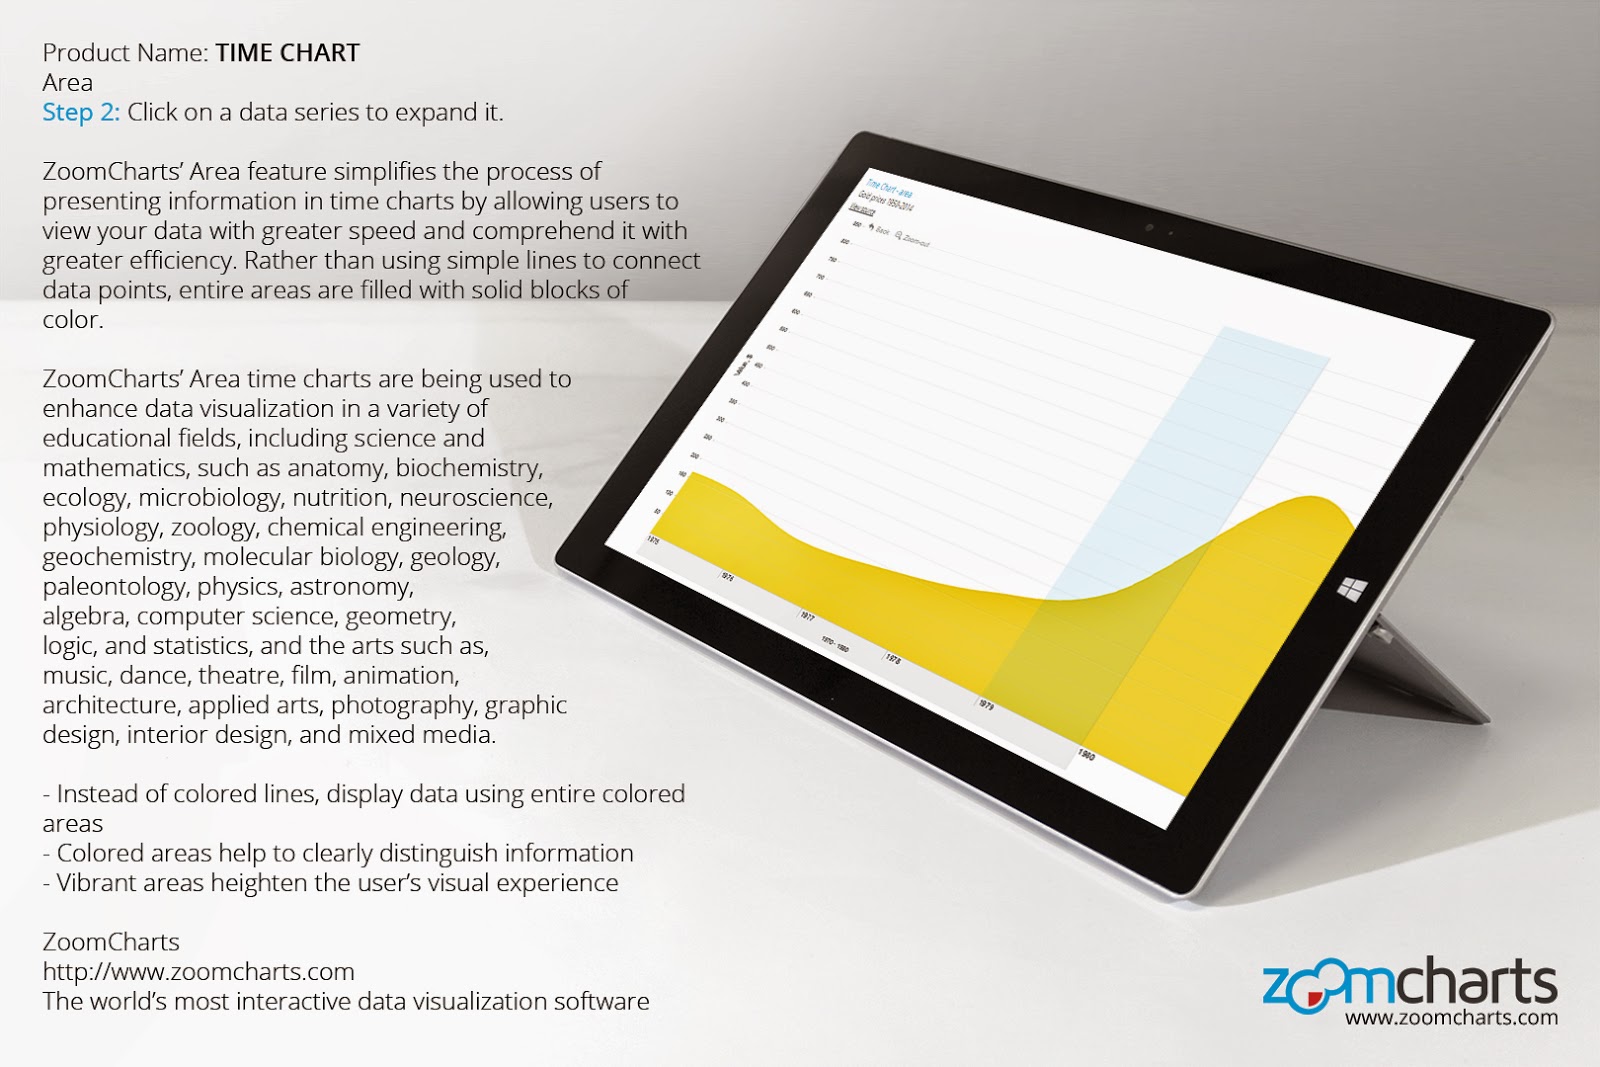
Step 2 Click on a data series to expand it.

Step 3 Sort and display specific types of data using the filters at the top right.


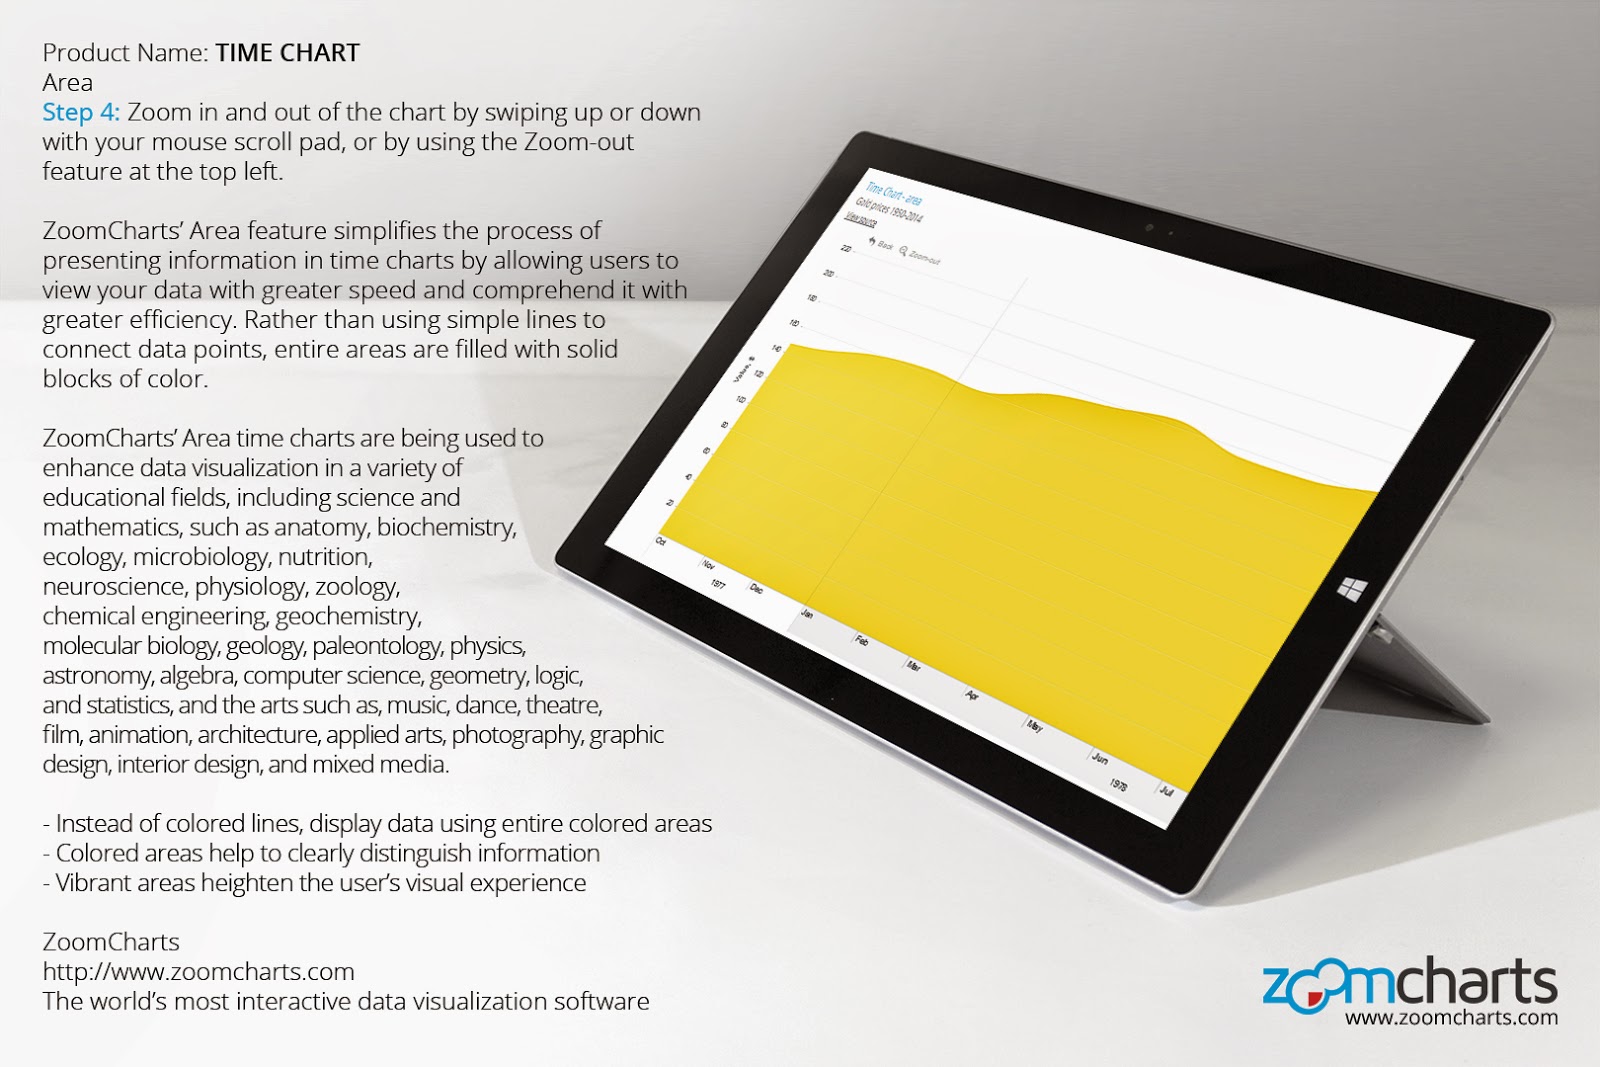
Step 4 Zoom in and out of the chart by swiping up or down with your mouse scroll pad, or by using the Zoom-out feature at the top left.

Check out ZoomCharts products:

Network Chart
Big network exploration
Explore linked data sets. Highlight relevant data with dynamic filters and visual styles. Incremental data loading. Exploration with focus nodes.

Time Chart
Time navigation and exploration tool
Browse activity logs, select time ranges. Multiple data series and value axes. Switch between time units.

Pie Chart
Amazingly intuitive hierarchical data exploration
Get quick overview of your data and drill down when necessary. All in a single easy to use chart.

Facet Chart
Scrollable bar chart with drill-down
Compare values side by side and provide easy access to the long tail.

ZoomCharts
http://www.zoomcharts.com
The world’s most interactive data visualization software

Thursday, 19 February 2015

Time Chart Stacked Bars for PC

https://zoomcharts.com/en/gallery/all:time-chart-stacked-bars-global-emissions

ZoomCharts’ Stacked Bar feature makes reading and comparing information in time charts easy. There is no need to scroll or flip between separate charts. This handy tool makes it possible to view separate data series and detailed information together.

Stacked Bar is one of many ZoomCharts features being used to enhance data visualization in several fields, including science and mathematics, such as anatomy, biochemistry, ecology, microbiology, nutrition, neuroscience, physiology, zoology, chemical engineering, geochemistry, molecular biology, geology, paleontology, physics, astronomy, algebra, computer science, geometry, logic, and statistics, and the arts such as, music, dance, theatre, film, animation, architecture, applied arts, photography, graphic design, interior design, and mixed media.

- View several data series in one chart
- Stacked bars simplify data display
- Data is easy to read and compare


Step 1 Hover over a data series to display detailed information.


Step 2 Click on a data series to expand.


Step 3 Sort and display specific types of data using the filters at the top right.


Step 4 Zoom in and out of the chart by swiping up or down with your mouse scroll pad, or by using the Zoom-out feature at the top left.


Check out ZoomCharts products:

Network Chart
Big network exploration
Explore linked data sets. Highlight relevant data with dynamic filters and visual styles. Incremental data loading. Exploration with focus nodes.

Time Chart
Time navigation and exploration tool
Browse activity logs, select time ranges. Multiple data series and value axes. Switch between time units.

Pie Chart
Amazingly intuitive hierarchical data exploration
Get quick overview of your data and drill down when necessary. All in a single easy to use chart.

Facet Chart
Scrollable bar chart with drill-down
Compare values side by side and provide easy access to the long tail.

ZoomCharts
http://www.zoomcharts.com
The world’s most interactive data visualization software

Time Chart Custom Background Image for Mac

https://zoomcharts.com/en/gallery/all:time-chart-custom-background-image-historical-weather-paris-france

With ZoomCharts’ Custom Background Image feature, you can incorporate custom visuals into your graphs to enhance data presentation. Instead of a bland background, why not support your data with visuals that match your subject matter?

ZoomCharts’ Custom Background Image is an attractive feature currently being used to meet the advanced data visualization needs of various educational fields, including sciences and mathematics, such as anatomy, biochemistry, ecology, microbiology, nutrition, neuroscience, physiology, zoology, chemical engineering, geochemistry, molecular biology, geology, paleontology, physics, astronomy, algebra, computer science, geometry, logic, and statistics, and the arts such as, music, dance, theatre, film, animation, architecture, applied arts, photography, graphic design, interior design, and mixed media.

- Interactive chart that supports large amounts of data
- Chart background can be customized to suit your needs
- Data presentation is functional and visually appealing


Step 1 Customizable images allow you to style your chart background.


Step 2 Hover over time segments to display detailed information.


Step 3 Click on a time segment to expand data.


Step 4 Zoom in and out of the chart by swiping up or down with your mouse scroll pad, or by using the Zoom-out feature at the top left.


Check out ZoomCharts products:

Network Chart
Big network exploration
Explore linked data sets. Highlight relevant data with dynamic filters and visual styles. Incremental data loading. Exploration with focus nodes.

Time Chart
Time navigation and exploration tool
Browse activity logs, select time ranges. Multiple data series and value axes. Switch between time units.

Pie Chart
Amazingly intuitive hierarchical data exploration
Get quick overview of your data and drill down when necessary. All in a single easy to use chart.

Facet Chart
Scrollable bar chart with drill-down
Compare values side by side and provide easy access to the long tail.

ZoomCharts
http://www.zoomcharts.com
The world’s most interactive data visualization software